I've been talking with Seth today on how we can answer questions about the status of l10n. My grumpy argument was that I wouldn't know how to make graphs over time actually show progress, instead of just "failure". I had two naive graphs, one is showing all missing strings summed up over all locales. That graph would be dominated by the long tail of several dozen locales with a few hundred strings each, and you wouldn't see a dozen fighting over a few strings each.
The other is what I nick-name "porcupine graph", show how many locales have no missing strings, vs those that have some missing strings. This is what's actually implemented on the l10n dashboard as tree progress graphs. But how ever small a string change would be, it goes to all red. And it doesn't help that one can't mix green and red color gradients, so the graph usually shows spikes of red and a little black.
Who'd want that as their progress stats, huh?
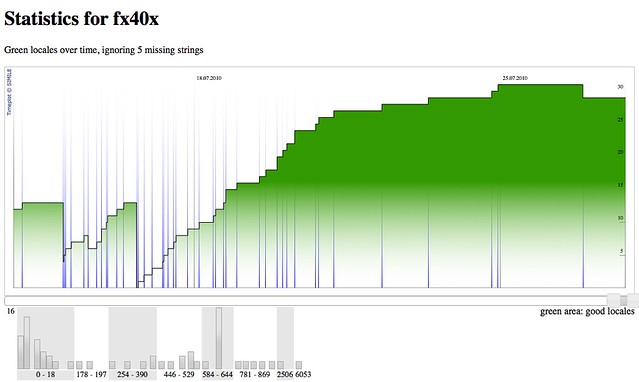
Now, during the chat with Seth I came up with the idea to just give a little bit of leeway, and accept some missing strings to be OK, at least for some time. I filed bug 582280 on that, and made a rough initial implementation of it. Nothing fancy, just a constant ignored bound of missing strings. Let's see how the past two weeks of Firefox 4 look now, with just a total of 5 missing strings being OK, ?bound=5:
Now Churchill won over the porcupine, but it's still pretty red. Which is OK, we haven't even branched yet, right? So I went ahead and figured I'd add an option hideBad:
Wow, progress. This graph actually looks like our community rocks as much as it does. Gets me grumpy, because this was really just about half an hour of work, plus a few years of thinking.
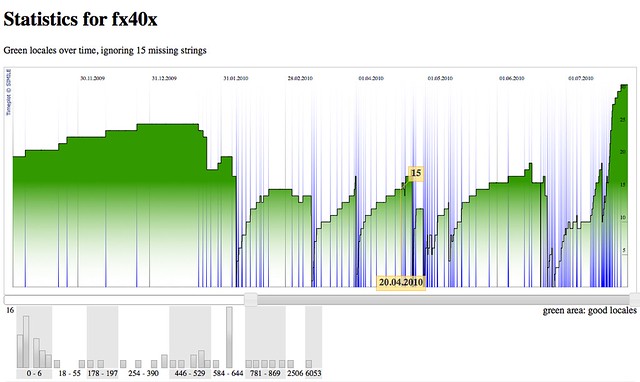
Now, how do we look on the long run, say, well over half a year? Bumping the bound up to 15, we're doing like
Pretty good, heh? You can play with it on the dashboard, too. The overall take aways would be:
We have about 20 locales that really track trunk.
We didn't have that many landings with a high amount of added strings.
I like both :-).


